Automatic Vision PLC code generation with TwinCAT Analytics
Until a few years ago, vision solutions in machines were exclusively stand-alone systems that communicated with the actual machine control system via interfaces. Programming was rather code-heavy via the integration of vision libraries or special hardware that facilitated straightforward configuration. By integrating image processing into machine control, TwinCAT Vision already eliminates the need for interfaces and allows programming to be carried out as usual according to IEC 61131-3. The fusion of TwinCAT Vision and TwinCAT Analytics means both approaches are now combined for optimal engineering, and applications are facilitated by means of simple configuration.

Taken individually, the task distribution between the two TwinCAT products is clear: TwinCAT Vision is designed to create image processing operations in line with machine control. The cameras are configured via a graphical interface in much the same way as a drive axis would be. The image processing itself is programmed entirely in the PLC, for which a very extensive PLC library is available. TwinCAT Analytics, on the other hand, offers many different algorithms for evaluating a machine’s process data, such as high-resolution vibrations, status values, and positions of drives. The major difference is in the use of the algorithms. In contrast to working with PLC libraries, TwinCAT Analytics is used on a purely graphical basis in a configuration editor. The algorithms themselves are based on the same PLC libraries and can be used by the Analytics user, once their configuration is complete, for automatic PLC code generation in a newly created PLC project. The entire process is incredibly straightforward and does not require the user to perform any programming themselves.
Extensive analytics functions
TwinCAT Analytics offers algorithms ranging from very simple to highly sophisticated, including basic edge counters, limit monitoring, and envelopes, through to spectral analysis, correlation functions, and unsupervised clustering methods from the field of machine learning. In total, there are more than 150 algorithms for evaluating process data. These are organized in networks and can be individually linked to form chains, which can be saved as templates for future reuse. Many users take advantage of this possibility in a very application-specific manner, resulting in additional sections in the algorithm toolbox such as those for specific machine modules or mechanical components. As a result, machine module names such as "Module MH_Milling_Long3c" can be listed in the toolbox, providing service technicians with specific algorithms for different parts of various machine types. Together with the TwinCAT Scope software oscilloscope, this data can be not only graphically transferred to processing, but also graphically displayed in the form of time-based line charts, bar charts, or 3D charts. Results of the algorithms can be linked to the charting along with the timestamp by means of simple drag-and-drop actions, allowing events to be sorted and marked with machine cycle accuracy. This applies to both live machine data and historical data where, for example, logical operators can be used to look for specific state associations in the data stream. The result of this is incredible time savings – especially when searching for malfunctions. But the path to true engineering simplicity lies in automated PLC code generation – although what is it even for?
Generally speaking, TwinCAT Analytics with code generation allows analyses to be executed continuously in a PLC runtime environment. This can be the machine control runtime itself or the one on a remote device that runs in parallel to the machine controls and is therefore decoupled from the actual control process. Decoupling such as this offers the advantage that analyses can always be exchanged and updated independently of the process – a common scenario, especially with steadily increasing experience in data analytics. The use of sophisticated algorithms along with machine control itself is also far from standard. Many users hold a respectful perspective toward programming with algorithms such as these and integrating them into the existing control code. What’s more, it is a waste of time for users to have to systematically retype things that they have already configured and tested. Therefore, automatically generated code avoids programming errors and saves a great deal of time during the development phase. This is even more obvious when users not only automatically generate the analysis code, but also a web-based dashboard for displaying the analysis results.
Vision integration with clear advantages
Since camera systems are increasingly replacing conventional sensors on machines, and since several sensors can be combined by a single camera system, it is a logical step to integrate the evaluation of image data in TwinCAT Analytics. Added to this is the fact that the low-code approach of TwinCAT Analytics is also widespread in many specialized vision tools, and is consequently an ideal complement for TwinCAT Vision. This makes it an obvious next step to gradually integrate the large number of vision algorithms into TwinCAT Analytics. The advantage here is clear, in that creating a vision application with TwinCAT no longer automatically starts with programming. The required algorithms can be conveniently put together in the configuration process before being run and tested in a non-real-time context. Particularly during the initial evaluation phase of an application such as this, many functions and parameters have to be tried out, and, now, the former constant activation of real-time configurations and downloading of code can be eliminated. Independence eliminates the need to restore a machine state so that new results are comparable to previous ones. This is particularly useful in end-of-line tests where reject identification is required, to name just one example.
In addition to the non-real-time context, the additional possibility of being able to use historical raw image data again and again for optimizing the evaluation and parameters is especially helpful. The output images at the modules of the algorithms, such as color and median filters, can be linked to inputs from other vision algorithms, such as Detect Blobs or Read QR Code. Once the ideal setting for one or more camera systems has been found, the required real-time PLC code based on the TwinCAT Vision library can be generated and downloaded to the control system at the push of a button. The generated PLC code is transparently readable and object-oriented. Its structure is based on the previously configured networks, which allows users to find their way around the generated code with ease. The application will ideally be finished at this point, although specific changes can be made at any time – including a subsequent code compare and merge step. It is also very convenient for users that the detailed documentation of the TwinCAT Vision library can be used to understand the Vision-specific part of the generated code. This functionality alone simplifies engineering significantly, saving a lot of time and the associated engineering costs.
More detailed evaluation via software oscilloscope
This is far from being the only advantage of Vision integration into TwinCAT Analytics, as other standard TwinCAT Analytics functions are also intended to benefit image data evaluation. These include the ability to drag and drop image data into TwinCAT Scope in the same way as process data. The output image of a Vision algorithm is dragged into the scope and can also be visualized directly in a cam chart on an individual basis. If required, the image can be dragged into one of the process data charts using the mouse. After that, it appears in the background of the chart, with a color-coded marker assigning details such as the processing date and image to the time axis.
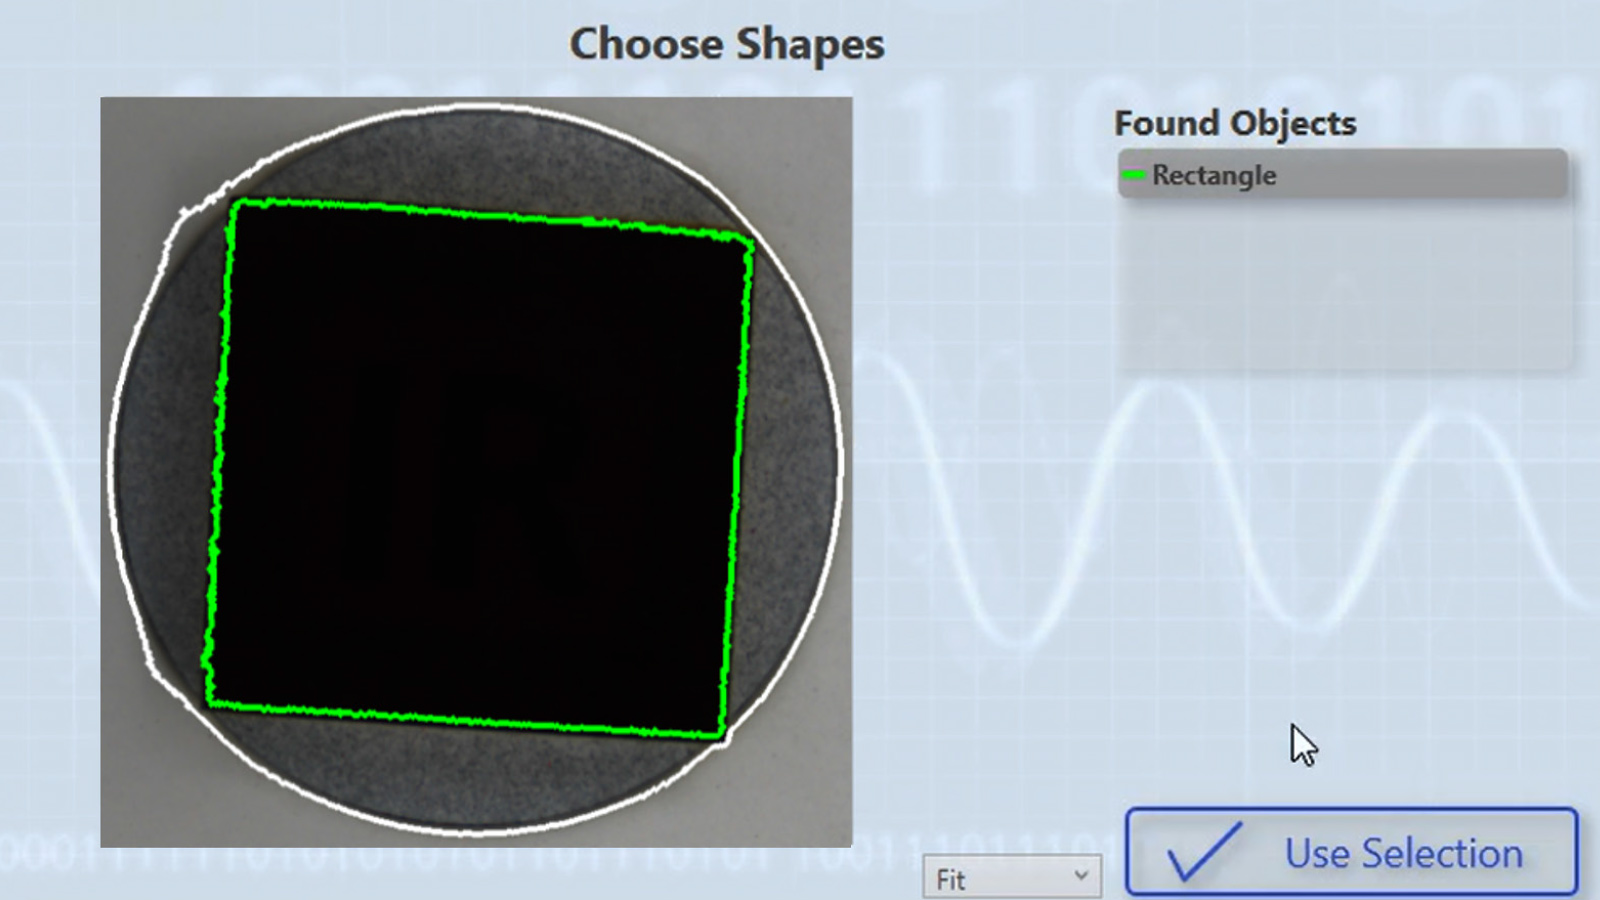
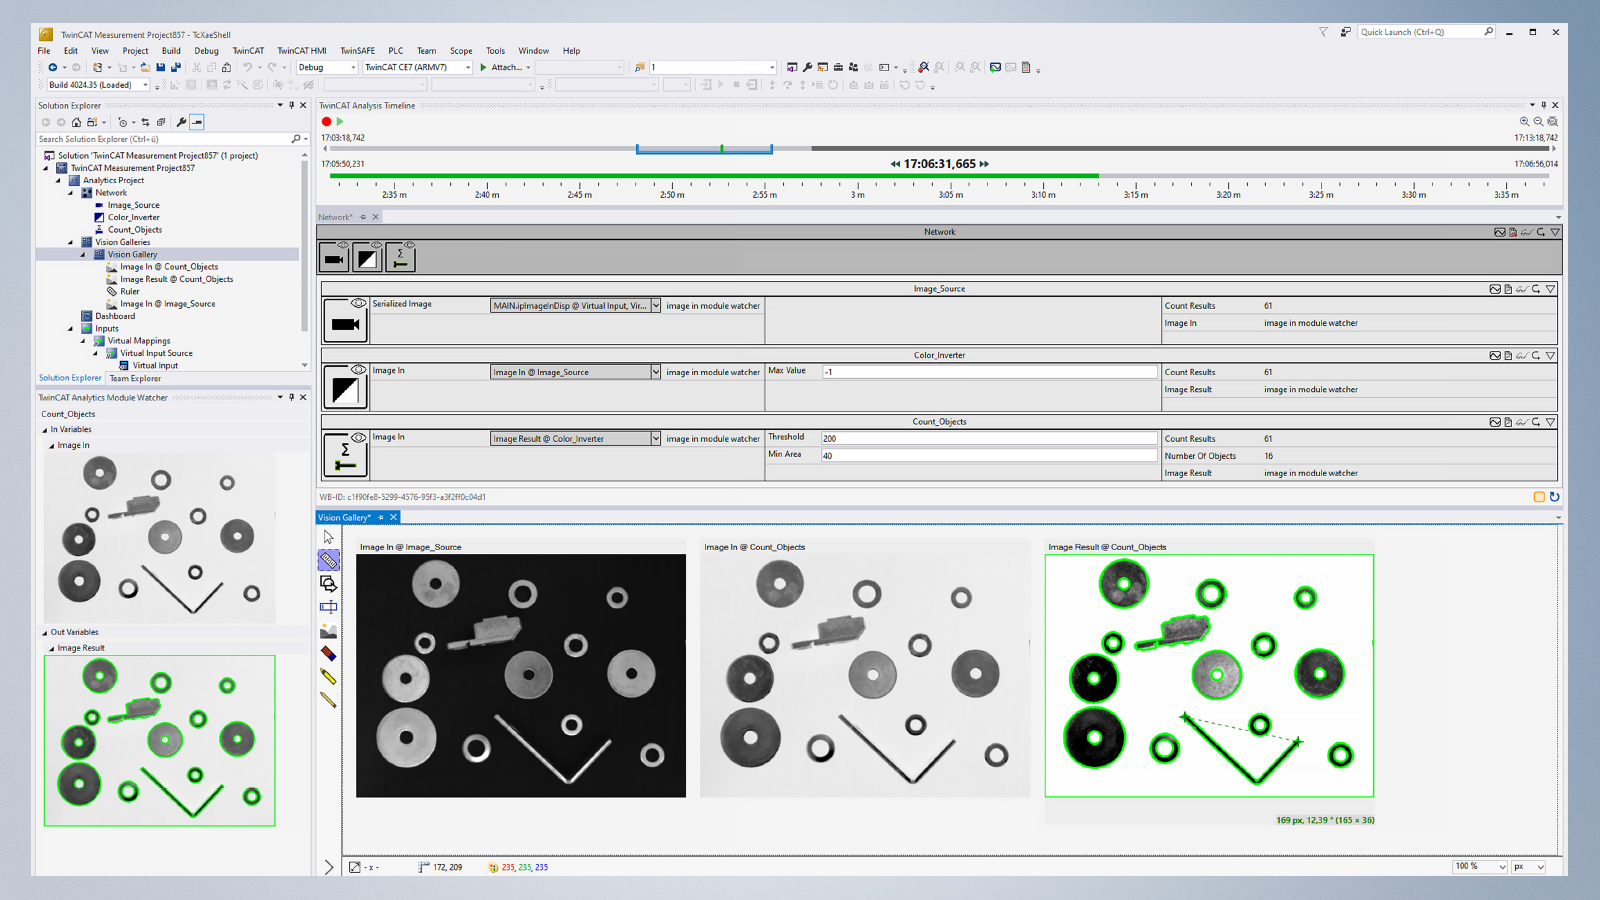
Of course, Vision-specific functions have also found their way into TwinCAT Analytics. The goal of continuous product development is to create an interface that ideally supports the user with special elements adapted to the respective algorithm. The way algorithms are implemented in Analytics is as standardized as necessary and as individual as possible. This makes for intuitive elements that facilitate the process of saving found contours that have to be reloaded later for a contour adjustment, for example. Other functions such as the tool window for the module watcher are generalized for all algorithms. Depending on the selected image processing module, the watcher displays input and output images directly. The image gallery, on the other hand, allows individual compilations of multiple input and output images from different algorithms. For that purpose, images from a stream or single images from the hard disk can be loaded and pinned, allowing them to be compared with current images. The gallery also offers a number of standard functions like the color picker, pixel measurement, pixel position, and contrast settings. Additional shapes and labels can be added to each image. An image processed in this way is available for export to various image formats.
Continuous further development
In addition to the gradual expansion of the algorithm, the next development steps relate to the automatic generation of vision controls for the web-based dashboard. The dashboard is used to permanently display image processing results for different user roles, which can be defined in the analytics engineering. Thanks to the platform-independent HTML 5 dashboard, it is not only experts such as developers, application engineers, commissioning engineers, and service technicians that benefit from the combined TwinCAT Analytics Vision solution, but also machine operators and production and operations managers. The latter can call up the most important production data as needed via mobile devices – regardless of location and at any time.
Further information


