TwinCAT 3 Analytics
New interfaces and visualization options
Văn Phòng Đại Diện tại Việt Nam
+84 28 7300-2439
info@beckhoff.com.vn
www.beckhoff.com/vi-vn/

New interfaces and visualization options
The already available TwinCAT 3 Analytics functions have been extended further. New interfaces increase interoperability in terms of data communication and data management. In addition, optimized visualization options create added ergonomic value for end users.

Most users who deal with the evaluation of machine data inevitably have to consider data storage first. The information content varies from high-resolution raw data to pre-processed data that is written at longer intervals, from seconds to hours. The tooling required for this should be simple and easy to configure. At the same time, the data should not only be proprietary, but also be accessible to third-party software.
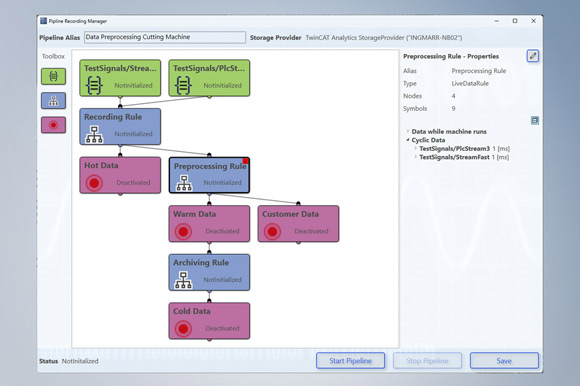
The TwinCAT 3 Analytics Storage Provider implements these requirements optimally. With the current redesign, it is not only multi-source and multi-store capable, but can also map a complete storage strategy. As a configuration solution, it can write data to a small binary ring buffer, for example, where the data remains for a few days at full resolution for support and service purposes. They can then move the data to a second store, which provides e.g. data for the next three months on an edge device. The data is no longer stored in full resolution, but is sampled down and averaged in order to achieve data reduction. In the long term (over several years), the analytics storage provider can calculate certain key values from the data of the second store and store them in plain text, for example in a Microsoft SQL® on a central server.
In addition to Microsoft SQL®, InfluxDB2 is also offered for data storage in plain text. The math can be applied to the data in the stream. The individual storage strategies are created graphically in an editor. This means that even hierarchically nested storage structures can be mapped very easily. The usual programming work required to move data from store A to store B is no longer necessary.
Included in:

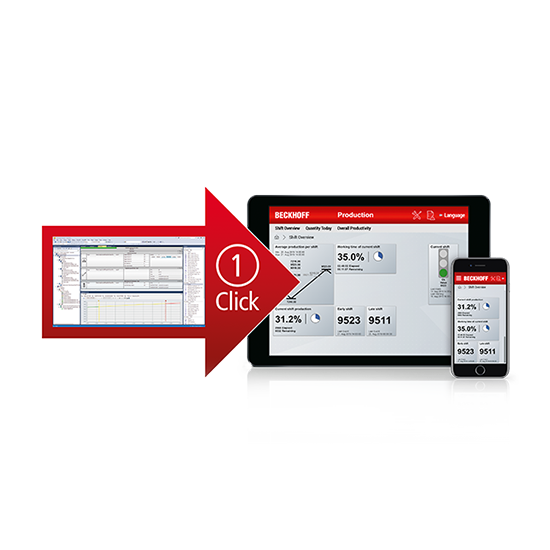
With the TwinCAT 3 Analytics Workbench, PLC code and HMI dashboards can be automatically generated from configured evaluations of process and image data. This process is very simple. A specific or self-created TwinCAT HMI control can be selected for each evaluation. Once the colors, logos, and background images have been selected, they are generated and downloaded to a target system. The dashboard is based on the evaluations made in the generated PLC code.
As end users may prefer a very specific type of display, the interactive dashboard function allows them to display and arrange the generated controls individually for each user. The user does not have to go back to Engineering. The user can set up the parameters right in the web browser.
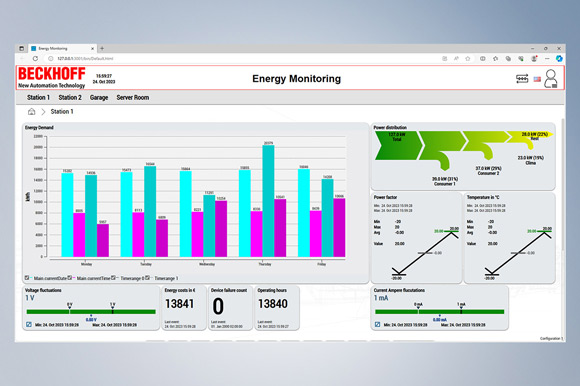
The interactive chart function is a new feature. This allows a user to add new charts to the dashboard as required – even without Engineering. Chart type, variables, and time intervals can be selected in the web browser. This makes it very easy to carry out data comparisons, for example. Current production data can be compared with the data from previous days, or the energy consumption data for the current month can be contrasted with the data from the same period in the previous year.
The new functions are perfect for those leading production, for energy management system operators, and basically anywhere that runtime data needs to be displayed in a highly customized way.
Included in:

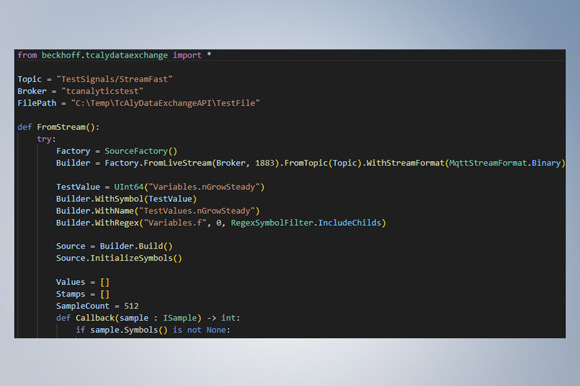
TwinCAT Analytics is the byword for top performance in data analysis. Data is provided in high resolution in binary files or as binary MQTT streams. With the new TwinCAT Analytics Python API, the files and streams can be used directly in Python. The data is thus fed into an even broader spectrum of algorithms. Alternatively, the paid-for API can also serve as a data source by writing analytics files or generating MQTT streams. The evaluation then takes place in reverse in the TwinCAT Analytics engineering and runtime tools.
The same concept is also available to .NET code developers. This makes it very easy to write small applications for data conversion in one direction or the other.
Included in:

The TwinCAT Analytics product family offers a complete workflow for data acquisition, storage, analysis and visualization in dashboards.

The TwinCAT 3 Analytics Logger ensures the cycle-synchronous acquisition of process and application data from the machine controller. The logger is characterized by high performance because it works directly in the real-time context of the TwinCAT controller. The data acquired is optionally transmitted to a message broker via the IoT communication protocol MQTT or stored locally in a file on the hard drive of the machine control and recorded with ring buffer functionality. The configuration necessary for this is done in Microsoft Visual Studio® within the TwinCAT project. All variables of the process image and the PLC application can easily be added to the configuration via checkbox without any programming effort.

The TwinCAT 3 Analytics Storage Provider is an MQTT client and provides an interface between one or more MQTT message brokers and the relevant data storage units. Various controllers can send data via MQTT, which the storage provider can then store centrally. This can be cyclic raw data or pre-processed data. Historized data is also imported via the storage provider. The storage provider can thus output the data in Engineering for the service technician or in an analytics dashboard in the interactive chart for the production manager.

The TwinCAT 3 Analytics Runtime is the runtime “container” for the Analytics application, which was configured and developed in the TE3500 TwinCAT 3 Analytics Workbench. The runtime can be installed locally, on remote hardware or in a virtual machine. It also contains the TF2000 TwinCAT 3 HMI Server, which hosts the analytics dashboard. In summary, the TwinCAT 3 Analytics Runtime represents a bundle of different licenses. It contains a PLC runtime, the Analytics PLC library, the IoT connection with MQTT and HTTPS/Rest, the Storage Provider connection, the TwinCAT 3 HMI Server and a corresponding client package, so that several users can view the designed Analytics Dashboard simultaneously.

The TwinCAT 3 Analytics Runtime Base is the container in which the analytics application runs that was configured and developed in the TE3500 TwinCAT 3 Analytics Workbench. The runtime can be installed locally, on remote hardware or in a virtual machine. It is the ideal product if an analysis is to be operated “headless” or if a visualization of your own is already available.